South African Workshop Presentations
Two Visibility Workshops have been held on the 28 – 30 January 2010 and 2-4 March 2011 and a Partner & Training Workshop on the 15 – 22 March 2013.
2.1 Abstracts of South African Workshop (January 2010)
2.1.8 Public Private Partnership for science and technology in Bioenergy, discussing also the issues of food versa fuel and food security in Southern Africa

Presenter:
Erhard Seiler
Southern African Biofuels Association
Energy Mix
Energy mix is the best precondition for energy supply security and energy price stability. Energy market is a regulated market and nothing is possible without political support and new valuation of resources.
Electricity Situation of Southern Africa
- Southern Africa needs 563 billion US$ during next 25 years investment.
- Electricity access in Africa is the least among developing regions, under 20%.
- 40% of electricity is used each by North & South, while the remaining 46 countries uses 20%.
- Electricity access to rural areas is less than 10%.
- The average price is 0.13 US$, one of most expensive energies in the world.
Transport situation in South Africa
- SA: 19th largest user per capita in the world on crude oil bases
- 450 – 500 bn Rand consumed for land transport
- Approx.270 bn for personal transport
- Approx 14% of GDP is used for transport
- The situation is undermining economic growth: -transport is essential for economic growth -transport is limiting economic growth
Energy Mix in Transport
- The upward trend in crude oil prices and the expected long term crude oil price adjustment as a commodity with limited availability allowing alternative fuels as a feasible option:
- Conventional fuels, electricity, bio fuels, hydrogen, (gas and liquids).
- Hybrid systems, flexible fuels engines, fuel cells
- In future - we have to live with a variety of fuels and propulsion systems, with a mix of public transport and individual transport.
South Africa and GHG emissions
- 70 % of energy consumption is for transport
- Transport sector as end user is the largest emitter of GHG emission.
- Kyoto – protocol 1997 commits signatories to reduce GHG emissions by 2012 by 5%.
- SA – is the 5 largest GHG emitter per capita but rated as a developing country (list 2).
- Green house gases can be captured, stored and or used as fuel for photosynthesis and others.
- Storage: (i) geological storage in soil, water and geological formations (ii) off shore, on shore in national and international areas.
- Usage:(i) photosynthesis in: forestry / agriculture /nature conservation (ii) biotechnologies: algae- technologies, bacterial technology.
SA Agriculture and Agro –processing sector
- Is the second largest employer in SA (11%).
- Had a huge structural and technological development in the past 15 years.
- 500 000 jobs lost.
- Cost developments: 22,7 fertilizer, 18,2 fuel, 12% wages and salaries.
- Is a business, which requires a return on investment and coverage of cost.
- Food prices not determined by SA – agriculture but generating huge fluctuations.
- Bio energy offers the largest stable market for agriculture.
- Available agricultural land underutilized,
- Positive energy balance in biofuels if sustainable technologies and policies used.
- There is no conflict between food and non-food production in Southern Africa.
SA Forestry and Wood processing Sector
- SA has the largest in Southern Africa.
- Provides 1.4 % of GDP and employees more than 170 000 people in SA.
- 1.33 mio Ha in used with huge effect on climate protection.
- Approximately 35% in timber saw milling is waste and only a fraction is used for bio energy.
- Southern Africa is suffering alien plant invasion
- Cellulose is one of the most important future raw materials for biofuels .
- Has widely underutilized potential.
Generations of bio fuel technologies
- Raw materials: organic waste and agric. production
- First generation : extraction, separation, fermentation ,digestion , combustion 30 % fuel, 70 % for human consumption, ethanol and diesel,, solid biomass
- Second generation : pyrolise, gasification, production of a crude oil, which is than a raw material for processing
- Third generation biotechnologies : algae's
- 50 % crude oil, 50 % biomass for processing
- Fourth generation: integrated bio energy systems, electrical energy, liquid fuels , chemicals, heat : we call it biorefinery
Land availability
- Not managed land is exposed to erosion and degradation by the elements we have already fire, flood and dust hazards and are exposed to climate change effects.
- The use of land is part and parcel of national resources and the national economy, the regulations to own and use and the control mechanism influences the business environment.
- There is sufficient land available for bioenergy.
- Land without infrastructure and people using it have no value.
- The management and use of land is an obligation not a right.
- Land has to be used on sustainable manner – land use has to be regulated and controlled is a public and private issue.
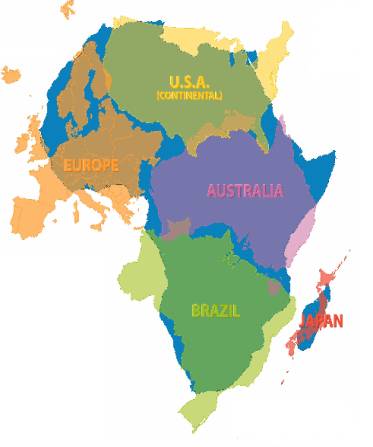
Size of African Continent Compared to Other Land masses |
|||||||||||||||||||||||||
 |
|
| Limitations & opportunities of Fossil fuels and Biofuels | |||||
|
 |